Standard Deviation Calculator
Calculate a standard deviation of the data set
Standard Deviation?
One of the fundamental approaches of statistical analysis is the standard deviation. It represents how much the result deviates from the mean value.
The Standard Deviation is abbreviated as ‘SD’ and represented by “σ”.
A low standard deviation implies that the values are around the mean, whereas a high standard deviation shows that the values are far from the mean.
What is a standard deviation?
Standard Deviation is the degree of dispersion of data points to their mean. It describes the distribution of values throughout the data sample and is a measure of the data points' variance from the mean.
The square root of the variance of a sample, statistical population, random variable, data collection, or probability distribution gives its standard deviation.
How to find Standard Deviation?
The standard deviation is a statistic that quantifies the dispersion of statistical data. The method of determining the deviation of data points is used to determine the degree of dispersion. As we know, the data set's variance is the average square distance between the mean value and each data value. The standard deviation, on the other hand, specifies the dispersion of data values around the mean. Here are two standard deviation formulas for calculating the standard deviation of sample data and the population standard deviation.
The formula for the Population Standard Deviation is as follows:
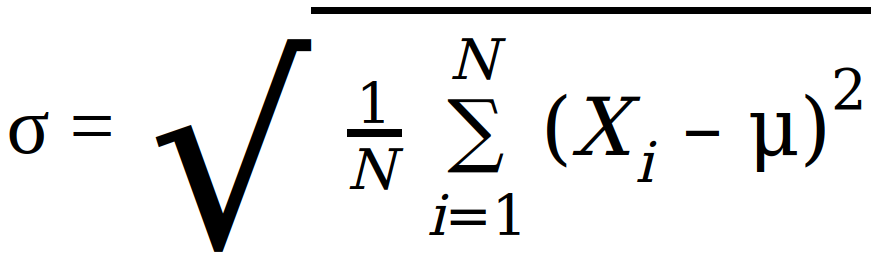
Where: σ = Population Standard Deviation, μ = Population mean
Similarly, the sample Standard Deviation Formula is as follows:
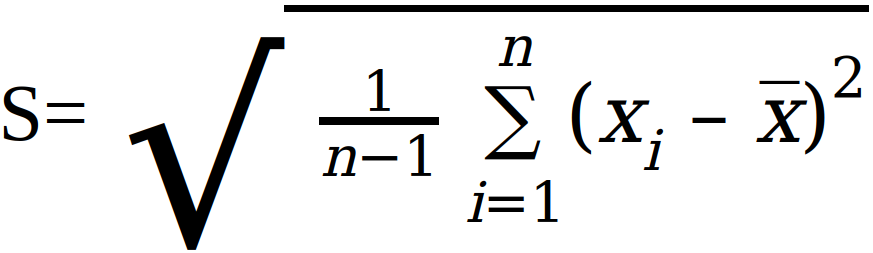
Where: S = Sample standard Deviation, x̅ = Arithmetic mean of the values
How to find Standard Deviation from Variance?
The variance is the average squared departure from the mean, whereas the standard deviation equals the number squared. Both metrics have a skewed distribution, but their units are different. The variance is represented in squared units, but the standard deviation is expressed in the original data's units.
The formula for the Population Variance is as follows:
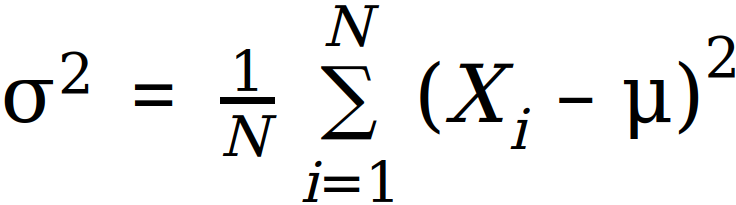
Where: σ2 = Population variance, N = Number of values in population, Xi = ith value in the population, μ = Population mean
Similarly, the sample Variance Formula is as follows:
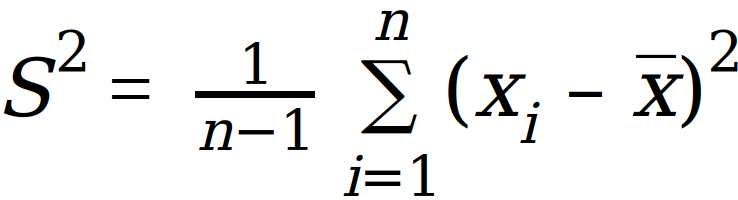
Where: S2 = Sample variance, n = Number of values in sample, xi = ith value in the sample, x̄ = Sample mean
By taking the square root of Variance, Standard Deviation can be evaluated for both population and sample data sets.
Difference between a Standard Normal Distribution and a Nonstandard Normal Distribution
| Standard Normal Distribution | Nonstandard Normal Distribution |
|---|---|
| It is commonly known as the z-distribution. | It is commonly known as the x-distribution |
| It has a standard deviation greater than the mean. | It has a standard deviation equal to or less than the mean. |
| It is a type of normal distribution having a mean of zero and a standard deviation of one. | It is a type of normal distribution having a mean of one and a standard deviation of zero. |